In the rapidly evolving landscape of higher education, online programs have become a game-changer for students seeking flexible learning options. Touro College, a renowned institution committed to academic excellence, is taking a bold step forward in online education with the future online Master of Social Work (MSW) program. Leading this groundbreaking initiative is Dr. Jamie Sundvall, a distinguished expert in Sherman, Texas. With her impressive credentials and extensive experience, Dr. Sundvall is poised to revolutionize how students engage with social work education.
A Visionary Leader in Online Education
Dr. Jamie Sundvall is an accomplished professional with a wealth of knowledge and expertise. As the Director of Online Education, she spearheads the development and implementation of the future online MSW program at Touro College. With her strong background in social work, psychology, and trauma services, Dr. Sundvall brings a unique perspective to online education.
Impressive Credentials
Remarkable achievements mark Dr. Sundvall’s academic journey. She holds a Master of Social Work (MSW) degree from a CSWE-accredited program, specializing in Clinical Practice and Gerontology. Furthermore, she earned her Ph.D. in International Psychology, focusing on Trauma Services. Her dedication to advancing her knowledge and skills is evident through completing a prestigious two-year post-graduate trauma fellowship at The Johns Hopkins Hospital.
Vast Professional Experience
Dr. Sundvall has excelled in various roles throughout her career and significantly contributed to psychology, social work, counseling, and human services. As a commissioned officer in the United States Navy, she acted as a consultant, international liaison, and U.S. diplomatic advisor. Her expertise extends to program development and management, focusing on behavioral health and academic programming.
Driving Innovation in Online Education
Dr. Sundvall’s expertise in online, remote clinical, and educational program delivery positions her as a trailblazer in the field. She possesses a deep understanding of the intricacies involved in designing and implementing effective online programs. Her extensive experience in program evaluation, research, and publication allows her to drive evidence-based practices and ensure the delivery of high-quality education.
Navigating Accreditation Standards
One of the challenges faced by online programs is navigating rigorous accreditation standards. However, Dr. Sundvall’s experience leading national and international programs equips her with the knowledge and skills necessary to overcome these obstacles. She is adept at designing programs that meet and exceed accreditation requirements, ensuring students receive a rigorous and reputable education.
Statistics Speak Volumes
The impact of online education on the academic landscape must be addressed. According to recent statistics, enrollment in online programs has been steadily increasing over the years. In the United States alone, more than 6.6 million students took at least one online course during the fall of 2020. This figure represents a 4.8% increase from the previous year, highlighting the growing demand for online learning opportunities.
Additionally, studies have shown that online programs can offer equal or even superior educational outcomes compared to traditional face-to-face programs. A U.S. Department of Education survey found that students enrolled in online courses performed better, on average, than in conventional classroom settings. Online education’s flexibility and personalized learning experiences contribute to these favorable outcomes.
Embracing the Future of Social Work Education
As Dr. Sundvall leads the charge in developing the future online MSW program at Touro College, students can anticipate a transformative learning experience. By leveraging cutting-edge technology and evidence-based practices, Dr. Sundvall aims to create a program that prepares social work professionals to meet the evolving needs of individuals, families, and communities.
Conclusion
Dr. Jamie Sundvall’s impressive background, expertise, and passion for advancing online education make her an invaluable asset to Touro College. With her leadership, the future online MSW program promises to be a trailblazing endeavor in social work education. As online learning continues to shape the educational landscape, Dr. Sundvall’s vision and dedication will undoubtedly revolutionize the field, empowering students to make a lasting impact in their communities.
To learn more about Dr. Jamie Sundvall in Sherman, Texas, follow her on Twitter @JamieSundvall
Education goes beyond the boundaries of classrooms and textbooks. It encompasses fostering a sense of empathy, compassion, and community engagement. Tellis Education Services, known for its Adult Education High School Diploma Program, goes above and beyond academics by organizing an annual event called “Feed The Homeless.” This article will take you through the details of this remarkable event and its impact on the community.
The Importance of Adult Education
The Adult Education High School Diploma Program provided by Tellis Education Services offers an alternative path for individuals who, for various reasons, did not complete their high school education. Whether they left high school early or had to prioritize other responsibilities such as work or raising a family, this program offers a second chance to earn a high school diploma. It provides educational opportunities, instills confidence, and opens doors for better career prospects.
The Power of Community and Compassion
Tellis Education Services believes in the power of community and the importance of giving back. Every year, they organize the “Feed The Homeless” event, bringing together students, staff, and the local community to support those experiencing homelessness. It’s an inspiring display of compassion and a reminder of the impact we can make when we come together for a common cause.
Dr. Jonas Tellis, the driving force behind the event, shares his motivation: “We wanted to create an opportunity for our students and the community to make a tangible difference in the lives of those less fortunate. It’s about fostering a spirit of empathy and reminding ourselves that we all have a responsibility to help those in need.”
Event Details
This year’s “Feed The Homeless” event is scheduled for June 25th, 2023, from 1 pm to 3:30 pm in Linn Park, located in Downtown Birmingham, Alabama. The central location ensures accessibility for both volunteers and those in need. The park serves as a symbol of hope and a safe space for everyone involved.
Making a Meaningful Impact
The event aims to provide a warm meal and create an atmosphere of connection and support. Volunteers come together to prepare and serve various nutritious meals, including sandwiches, fruits, and beverages. Serving food with a smile and engaging in conversations helps break down barriers and fosters a sense of community.
Dr. Tellis emphasizes, “It’s not just about the food; it’s about showing empathy, respect, and understanding to individuals facing challenging circumstances. Our goal is to bring a moment of happiness, to let them know they are not alone, and to inspire them to keep going.”
Building Bridges and Encouraging Change
The “Feed The Homeless” event is not just a one-day affair; it sparks a desire for ongoing change and community involvement. Tellis Education Services partners with local organizations to provide resources and information about housing, job opportunities, and support services. This comprehensive approach aims to empower individuals experiencing homelessness, offering them a path toward a brighter future.
Conclusion
Tellis Education Services’ second annual “Feed The Homeless” event is a shining example of how education and community engagement can go hand in hand. By organizing this event, they demonstrate that education extends beyond the classroom, teaching students the importance of empathy and compassion. Through providing nourishment and support, they bring hope to those in need and inspire others to make a difference. Together, they are building a stronger and more compassionate community, one meal at a time.
Laboratory science is a vital field that plays a critical role in diagnosing and treating disease. Medical technologists, also known as clinical laboratory scientists, are responsible for performing a wide variety of tests on blood, tissue, and other bodily fluids.
These tests help doctors diagnose illnesses, monitor treatment progress, and determine the best course of care for their patients.
There are many benefits to a career in laboratory science.
1. It is a challenging and rewarding field that offers the opportunity to make a real difference in people’s lives. Medical technologists play a crucial role in the healthcare team, and their work is essential to diagnosing and treating disease.
2. Laboratory science is a stable and growing field with excellent job prospects. The Bureau of Labor Statistics projects that the employment of medical technologists will grow 13% from 2020 to 2030, faster than the average for all occupations. This growth is driven by the aging population, which is more likely to have chronic health conditions requiring laboratory testing.
3. Laboratory science is a well-paying field. The median annual salary for medical technologists was $53,120 in 2020. Salaries vary depending on experience, education, and the geographic location of the job.
4. Laboratory science is a versatile field that offers a variety of career options. Medical technologists can work in various settings, including hospitals, clinics, laboratories, and research institutions. They can also specialize in multiple areas, such as blood banking, hematology, microbiology, and immunology.
5. Laboratory science is an excellent career for people interested in science and math. Medical technologists must have a strong understanding of biology, chemistry, and physics. They must also be able to think critically and solve problems.
Suppose you seek a challenging and rewarding career with excellent job prospects. In that case, laboratory science may be the perfect fit. To learn more about this field, we found Sharon Fellner, a medical technologist that pursued laboratory science instead of a medical residency.
Sharon Fellner’s Story
Sharon Fellner is a medical technologist that currently works at a hospital in Baton Rouge, Louisiana. Sharon says that she loves her job because it is challenging and rewarding. She also enjoys that she can make a difference in people’s lives.
Sharon obtained her Bachelor’s degree in Biology from Louisiana State University in 2007, which laid the foundation for her future academic and professional pursuits. Sharon’s passion for genetics and the human body led her to pursue a Master’s in Human Genetics from Tulane University in 2011.
With a strong desire to contribute to the medical field, Sharon earned her Doctorate in Medicine from Louisiana State University Health Sciences Center in 2018. Sharon has displayed a keen interest in research throughout her academic journey and has published articles in renowned scientific journals. Her research has made significant contributions to human genetics.
Sharon Fellner says she would encourage anyone interested in a career in laboratory science to go for it. She says that it is a great career with excellent job prospects. She also says it is a rewarding career that allows you to make a difference in people’s lives.
If You Are Interested in a Career in Laboratory Science
If you are interested in a career in laboratory science, there are a few things you can do to get started. First, you should take science and math classes in high school. It would help if you also considered taking a college-level course in laboratory science.
Once you have completed your education, you must pass a certification exam. The American Society for Clinical Laboratory Science (ASCLS) offers a certification exam for medical technologists. To be eligible to take the exam, you must have a bachelor’s degree in medical technology or a related field.
If you pass the exam, you will be a certified medical technologist. This certification will qualify you for jobs in various settings, including hospitals, clinics, laboratories, and research institutions.
A career in laboratory science is a great way to use your science and math skills to make a difference in people’s lives. If you are interested in a challenging and rewarding career, then laboratory science may be the perfect fit.
With the college admissions process becoming more competitive each year, students seek ways to stand out. One way to do this is to participate in high school athletics.
Not only do sports teach valuable life skills, but they can also help students get into college. This blog post will discuss how high school athletics can boost college admissions.
How High School Athletics Can Help You Get Into College
There are many ways that high school athletics can help you get into college. First, athletics can show colleges that you are a well-rounded student. Colleges are looking for students involved in extracurricular activities. And athletics is a great way to show that you are active and engaged in your community.
Second, athletics can help you develop essential life skills. Sports teach you how to work hard, be a team player, and deal with adversity. These are all skills that colleges are looking for in their students.
Third, athletics can help you build relationships with coaches and teachers. These relationships can be helpful when you are applying to college. Coaches and teachers can write letters of recommendation that can help you stand out from other applicants.
How to Make the Most of Your High School Athletic Career
If you are interested in using high school athletics to help you get into college, you can do a few things to make the most of your experience. First, make sure you are a good student. Colleges seek academically qualified students, so keep up with your studies.
Second, get involved in other extracurricular activities. Colleges want to see that you are well-rounded, so get involved in clubs, organizations, and other activities outside of sports.
Third, build relationships with coaches and teachers. Let them know you are interested in attending college and ask them for advice on making your application stand out.
High school athletics can be a great way to boost your college admissions chances. Participating in sports shows colleges that you are a well-rounded student, have developed essential life skills, and have built relationships with coaches and teachers.
If you are interested in using high school athletics to help you get into college, ensure you are a good student. Get involved in extracurricular activities, and build relationships with coaches and teachers.
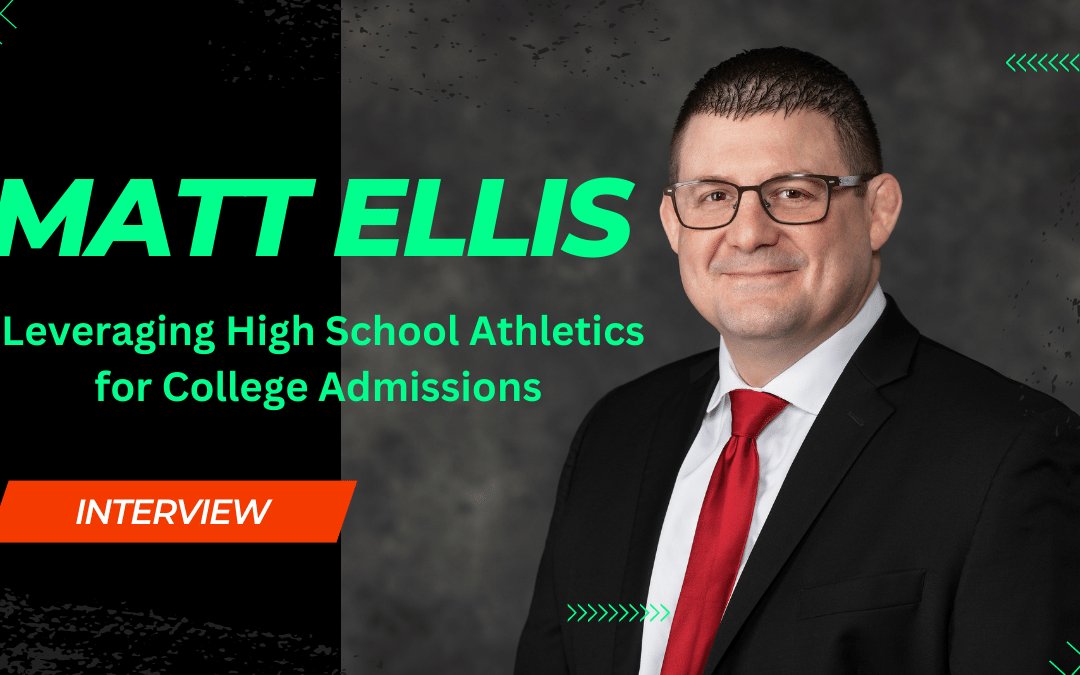
Interview with Matt Ellis
In addition to the information above, we also had the opportunity to interview Matthew Ellis. The Superintendent of the Prosser School District. Matt Ellis has a background in wrestling and coaching but found his true passion in education. He has been a Social Studies teacher, high school principal, and superintendent.
Matt is committed to creating a positive and supportive environment for students to learn and grow. He has focused on improving the district’s academic programs and increasing student achievement. Through data-driven planning and embedded professional development programs.
We asked Matt Ellis how high school athletics can boost college admissions. Here is what he had to say:
Q: How can high school athletics help students get into college?
A: High school athletics can help students get into college in several ways. First, athletics can show colleges that you are a well-rounded student. Colleges are looking for students involved in extracurricular activities, and athletics is a great way to show that you are active and engaged in your community.
When you play sports, you learn how to work hard, be a team player, and deal with tough situations – all of which are super valuable skills that colleges really like to see in their students.
Another great benefit of being involved in sports is that you have the opportunity to build relationships with coaches and teachers. These people can become really important allies when you’re applying to college. In fact, they can even write letters of recommendation for you, which can really help you stand out from all the other applicants.
Q: What advice would you give students interested in using high school athletics to help them get into college?
A: My advice to students interested in using high school athletics to help them get into college is to focus on academics. Colleges seek academically qualified students, so keep up with your studies.
Another thing you can do to boost your chances of getting into college is to participate in extracurricular activities that aren’t just focused on sports. Join clubs or organizations that align with your interests and passions, and show that you have a diverse set of skills and talents.
It’s also a good idea to connect with your coaches and teachers and let them know that you’re interested in pursuing higher education. They can offer valuable insights and advice on how to make your college application really stand out. Building strong relationships with them can also serve as great references for your application.
Q: What are some benefits of participating in high school athletics?
A: There are many benefits of participating in high school athletics. Athletics can help you stay physically fit, develop essential life skills, and build relationships with coaches and teachers. Being a student-athlete demonstrates to colleges that you are a disciplined, committed individual who can manage your time effectively. These are all qualities that colleges look for in applicants because it shows that you can balance academics with other commitments. Your ability to balance your studies and sports can help you stand out from other applicants.
About Matt Ellis
Matthew Ellis is a dedicated education professional with a wealth of experience in teaching, coaching, and leadership. He currently serves as the Superintendent of the Prosser School District. He works tirelessly to ensure that students receive a high-quality education that prepares them for success in the 21st century.
Matthew began his career in education as a Social Studies teacher, where he quickly discovered his passion for working with young people. Over time, he transitioned into administrative roles, serving as a high school principal before eventually assuming his current position as Superintendent.
Throughout his career, Matthew has remained committed to creating a positive and supportive learning environment for students. He understands that every student has unique strengths and challenges, and he works tirelessly to help each student reach their full potential.
One of Matthew’s critical priorities as Superintendent has been improving academic programs and increasing student achievement. He uses data-driven planning and embedded professional development programs to help teachers and staff members better serve their students. Under his leadership, the Prosser School District has seen significant improvements in student outcomes, including increased graduation rates and higher test scores.
Matthew’s background in wrestling and coaching has also helped shape his approach to education. He understands the importance of teamwork, discipline, and perseverance, and he works to instill these values in his students and staff members. He believes that with the right mindset and support, anyone can achieve their goals and positively impact the world.
Overall, Matthew Ellis is a dedicated and passionate education leader committed to improving students’ lives in the Prosser School District and beyond.
Charlotte is one of the most desirable real estate markets in America. This is due to a long-standing trend of investors and developers focusing on Sun Belt areas like Charlotte for their economic growth potential. According to the Charlotte Observer report, Charlotte is an 18-hour magnet. Its population growth and job market growth make it a popular destination for both businesses and people.
Charlotte, North Carolina is home to the largest population in North Carolina and the fastest growing metro area in the United States. It is because of its diverse economy and high quality of life that the housing market in Charlotte is so popular. Charlotte is home to some of the most popular pro-sports teams in the United States. It also has one the most pleasant year-round climates in America.
This article will discuss why Charlotte is worth investing in over the next year. Let’s first look at the factors that drive the Charlotte real estate market.
Population growth
Charlotte is one of the most rapidly-growing cities in America, with New Yorkers leading the pack in terms of new residents.
Fox 46 reports that the Charlotte metropolitan area is experiencing a steady increase in population each year. According to the most recent census, Charlotte’s population has increased by almost 20% in the last decade, which is more than twice the state’s growth rate.
Nearly 875,000 residents call Charlotte home, and more than 2.6 million live in the metro area. Charlotte and Mecklenburg County rank near top in U.S. population growth. There are many reasons that people and businesses are moving from other parts of the country to Charlotte.
Key Population Statistics:
Charlotte is home to over 2.6 million people and is the 23rd largest metro area in the United States.
According to the U.S. Census Bureau, Charlotte’s population has increased by 0.6% annually and 19.6% in the last ten years. Census Bureau.
Charlotte has seen a net increase in the population of more than 143,000 residents over the past decade.
The growth rate for Charlotte is 50%, while the region of Lancaster and suburban York are expected to grow at the fastest rates.
Seven Fortune 500 companies call the metro area home. It also houses the 2nd largest banking center in the country, after Wall Street. The job market in Charlotte is highly charged with high-tech, white collar and service- and distribution jobs. Concord, a suburban city in the Charlotte metropolitan area, was recently named one the 20 fastest-growing U.S. economies.
Employment Statistics:
The GDP in Charlotte has surpassed $184.8 billion and has grown by almost 65% over 10 years.
The employment rate in Charlotte has increased by 3.77% over the past year, while the median household incomes have increased by 6.98%.
According to the BLS April 2022, the Charlotte metropolitan area has a 3.2% unemployment rate.
The region of Charlotte added 75.491 jobs in the last 12 months. Transportation and warehousing saw the greatest growth, followed by finance, insurance and real estate.
Charlotte is expected to create nearly 137,000 jobs between now and 2028.
Charlotte has seen a rapid growth in technology jobs over the last five years. This makes Charlotte one of the most talented cities.
Charlotte is home seven Fortune 500 companies, including Honeywell, Nucor and Lowe’s as well as Sonic Automotive, Duke Energy, Sonic Automotive and Brighthouse Financial.
Other notable companies that are based in Charlotte include Compass Group USA’s Eastern Headquarters, Food Lion, Compass Group USA and Dixon Hughes Goodman. Albemarle Corporation is another chemical company.
Coca-Cola Bottling Co. has its headquarters here. It also has the second-largest Charlotte bottling plant.
Fluor, Piedmont Natural Gas and Siemens Energy are some of the major technology and energy companies that do business in Charlotte.
The University of North Carolina at Charlotte and Johnson & Wales University are just a few of many major colleges and universities in the Charlotte metropolitan area.
Charlotte’s residents hold 89.8% or more high school degrees, and 36.2% have a bachelor’s degree or advanced degree.
Interstate Highways I-85/77 intersect in the middle of Charlotte. They serve as major transportation and distribution routes to major American cities in the east, southeast and midwestern U.S.
Charlotte Douglas International Airport ( CLT) served nearly 50 million passengers in 2018 and handled close to 180,000 tons of cargo.
Charlotte is a major NASCAR center. The Blumenthal Performing Arts Center attracts top talent from all over the globe. Major professional sports teams such as the NFL Carolina Panthers or the NBA Charlotte Hornets call Charlotte home.
Real estate market
According to Realtor.com, home prices in Charlotte will rise by 5.6% by 2022 and sales volume by 9.9%. WalletHub ranked Charlotte as the best realty market in 2021, while Realtor.com ranked Charlotte the best Southeast housing market in 2021.
Key Market Statistics:
Zillow Home Value Index ( ZHVI), Charlotte, is $396 619 as of May 2022.
Charlotte’s home values have increased by 30% in the past year.
Charlotte’s home values have increased by 94% over the past five years.
Based on the latest report from Realtor.com (April 2022), the median list price for a Charlotte single-family home is $400,000
The median listing price per square footage for a Charlotte home is $223
The median number of days on the market is 35.
The median sold price for a Charlotte single-family home is $401,700.
The ratio of sale-to-list prices is more than 104%. This means that Charlotte homes are selling slightly higher than the asking price.
Myers Park, Charlotte’s most expensive neighborhood, has a median listing price $1.4 million.
Marshbrooke is the most affordable area to buy a house in Charlotte. The median listing price for a Charlotte home is $299,000.
Attractive renters’ market
It is becoming more difficult for younger buyers and those with lower incomes to buy a house. The influx in investors purchasing houses and making them rental properties in Charlotte makes it harder to get a house. In fact, Charlotte has been ranked as one of the most desirable markets for developers and real estate investors over the past several years due to its growing population and boom in high-tech jobs.
Key Market Statistics:
According to the most recent research by Zumper, Charlotte’s median rent is $1,900 per monthly for a 3-bedroom house.
Charlotte’s rents have gone up by 8% over the past year.
The average Charlotte rent has increased by 30% in the past three years.
The market’s 43% occupied housing units are occupied by renters in Charlotte.
Renters in Charlotte have the most affordable areas: Oaklawn, Reid Park, and Tyron Hills, where rents start at $975 per month.
The highest rent neighborhoods in Charlotte include Third Ward, Barclay Downs and Second Ward. Rents range from $3,911 to $5,293 per month.
Historical price changes and housing affordability
Renters can use a variety of metrics to assess the demand for Charlotte rental property, including historical price changes and affordability.
According to Freddie Mac’s monthly Home Price Index (FMHPI) report, home prices in the Charlotte-Concord-Gastonia MSA have grown by nearly 83% over the past five years:
April 2017 HPI: 153.6
April 2022 HPI 281.0
5-year change in home prices: 82.9%
One-year change in home prices: 27.3%
Monthly changes in home prices 2.2%
Kiplinger also publishes data about home price changes and affordability for the top 100 U.S. housing markets. Recent performance data for Charlotte’s real estate market include:
The Charlotte home price index has fallen 12.4% since the peak of last real estate cycle.
Charlotte’s home prices have increased by 77% since the bottom of the last real estate market cycle.
The Charlotte metro area’s housing affordability is rated 4/10, meaning it is among the most affordable areas to buy a home in the U.S.
Quality life
Charlotte is a great place to live, work, and play.
Mecklenburg County, where Charlotte is located, gave nearly a dozen reasons why Charlotte and North Carolina are booming during a recent economic updates presentation.
Stats on the Key Quality of Life:
The cheapest city in which to start a tech startup.
Top tech momentum market.
The metro area with the greatest growth in women-owned businesses
How do you begin your search? Roofstock has created a heatmap of Charlotte using our Neighborhood rating dynamic algorithm. This allows you to make informed investments by measuring school district quality and home values as well as employment rates and income levels.
Are you interested in learning everything there is to know about SEO? Let’s start by defining SEO. Then we will get into the details of how it works.
What is SEO?
SEO stands for Search Engine Optimization. It is the process of optimizing a website’s technical configuration and content relevance so that pages are easily found, more relevant, and more popular with user search queries. Search engines then rank them higher.
By highlighting content that meets user search requirements, search engines recommend that SEO efforts be made that improve both the user’s search experience and page ranking. This includes using relevant keywords in the title, meta descriptions, and headlines (H1), with descriptive URLs that contain keywords and not strings of numbers. Schema markup is also used to define the page’s content meaning.
Search engines allow people to find what they are looking for online. Search engines can be used to find information online, whether you’re looking for a product or a restaurant. They offer business owners a great opportunity to drive relevant traffic to their websites.
SEO (search engine optimization) is the process of optimizing your website so it ranks higher on a search engine results page (SERP) to increase traffic. The goal is to be on the first page for Google search terms that are most relevant to your target audience. SEO is all about understanding your audience and how your website should be configured.
These are the basics.
What is the working principle of search engines?
Search engines will provide search results for every query that a user types. They survey the wide range of websites on the internet to determine what they are looking for. They use a complex algorithm to determine which search queries will display the best results.
Google is the focus of SEO
Many people associate the term “search engine” with Google. Google has 92% of the global search engine market. Google is the most popular search engine, SEO is often focused on what works best for Google. It is helpful to understand how Google works.
Google’s needs
Google was created to provide the best search experience for its users or searchers. This means providing relevant results as fast as possible.
The search term (the user input), and the search results are the core elements of the search experience.
Google views this as a very positive search result. It’s also likely that users will click on the top result and be satisfied with the result.
Google’s money-making strategies
Google makes money from people trusting its search engine and valuing it. Google achieves this by providing useful search results.
Google offers businesses the chance to purchase an advertorial spot at the top search results pages. These listings are indicated by the word “Ad”. This pay-per-click (PPC), advertisements that Google sells through AdWords make Google money. These ads will be visible on queries that are more general.
These search results are almost indistinguishable from other search results except for the small label. This is deliberate since many users click on these search results and don’t realize they are ads.
Google is counting on this. Google generated $182.5 billion in advertising revenues in 2020. Although search functions are still Google’s core product, its advertising business is critical.
Search results anatomy
The SERPs are a mix of paid and organic search results. Organic results do not contribute to Google’s revenues. Google instead delivers organic results based upon its assessment of the site’s quality and relevance. Google may include images, videos, and maps depending on the type of search query.
The search terms that users have used to determine the volume of ads displayed on a SERP. For example, if you search for “shoes”, you would likely see a lot of ads. To find the first organic result, you will likely have to scroll further down.
This query generates many ads because the searcher may be looking for shoes online. There are many shoe companies that will pay to appear in AdWords results.
However, you will get different results if your search is for “Atlanta Falcons”. The top results will be related to this because the search is primarily tied to the name of the American football team. It’s still not a clear question. There will be news stories, a knowledge graph, and their homepage. These three types of results indicate that Google does not know your exact intent but will provide quick links to information about the team, their latest news, and their website.
Advertisers aren’t willing to bid on the keyword as there is no intent to purchase, so there aren’t any AdWords results.
If you change your query to “Atlanta Falcons Hat”, which indicates to Google that you may be shopping, the SERPs results will change to include more sponsored results.
SEO: What is its role?
SEO has one goal: to improve your rank in organic search results. SEO can be done in different ways: AdWords optimization, local optimization, shopping optimization, and enterprise SEO.
Although it might seem that there are too many elements competing for real estate on the SERPs, SEO is still a powerful and lucrative effort.
Google processes billions upon billions of search queries every day. Organic search results make up a large portion of this pie. While there are some upfront and ongoing investments required to maintain and secure organic rankings, each click that brings traffic to your site is free.
Now that you have an understanding of what SEO is and how to do it, you should dedicate at most six months to achieve results. SEO is not a strategy that you can “set and forget”. It is important to keep up with your content and to update it frequently. You should also continue to create great content to improve your site’s performance and show Google that you are still active.